2024 Transit On-Board Survey
The Greater Buffalo Niagara Regional Transportation Council (GBNRTC) and Niagara Frontier Transportation Authority (NFTA), along with consultant support, conducted an on-board transit survey of all NFTA bus and rail service in the Fall of 2024. The purpose of the survey was to:
Enhance NFTA’s knowledge of customer demographic profiles
Collect various fare media and transfer activity data
Meet FTA Title VI requirements
Data from the survey will be used to for NFTA’s planning and marketing purposes and to inform GBNRTC’s travel models.
What is an on-board survey?
An on-board survey is a study of how people use transit to travel in the Buffalo-Niagara region. Questions focus on trip behavior and demographics. Survey responses help transit planners better understand travel patterns and transportation choices of transit riders. Data from the survey is used to plan transit infrastructure improvements as well as service modifications and expansion.
How often are on-board surveys conducted?
On-board surveys are typically conducted every three to five years. The region’s last survey was conducted in 2021. Since that time, travel patterns in our region have changed, prompting the need to review how transit riders use NFTA-Metro services.
Who participated in the survey?
The survey was conducted on all NFTA-Metro fixed bus routes and light rail. A total of 6,283 surveys were collected based on a targeted sample size of 11%.
What did we learn from the survey?
The data collected provides current information on travel patterns and demographics for transit riders as well as service characteristics. Some key statistics include:
62,000 average weekday boardings
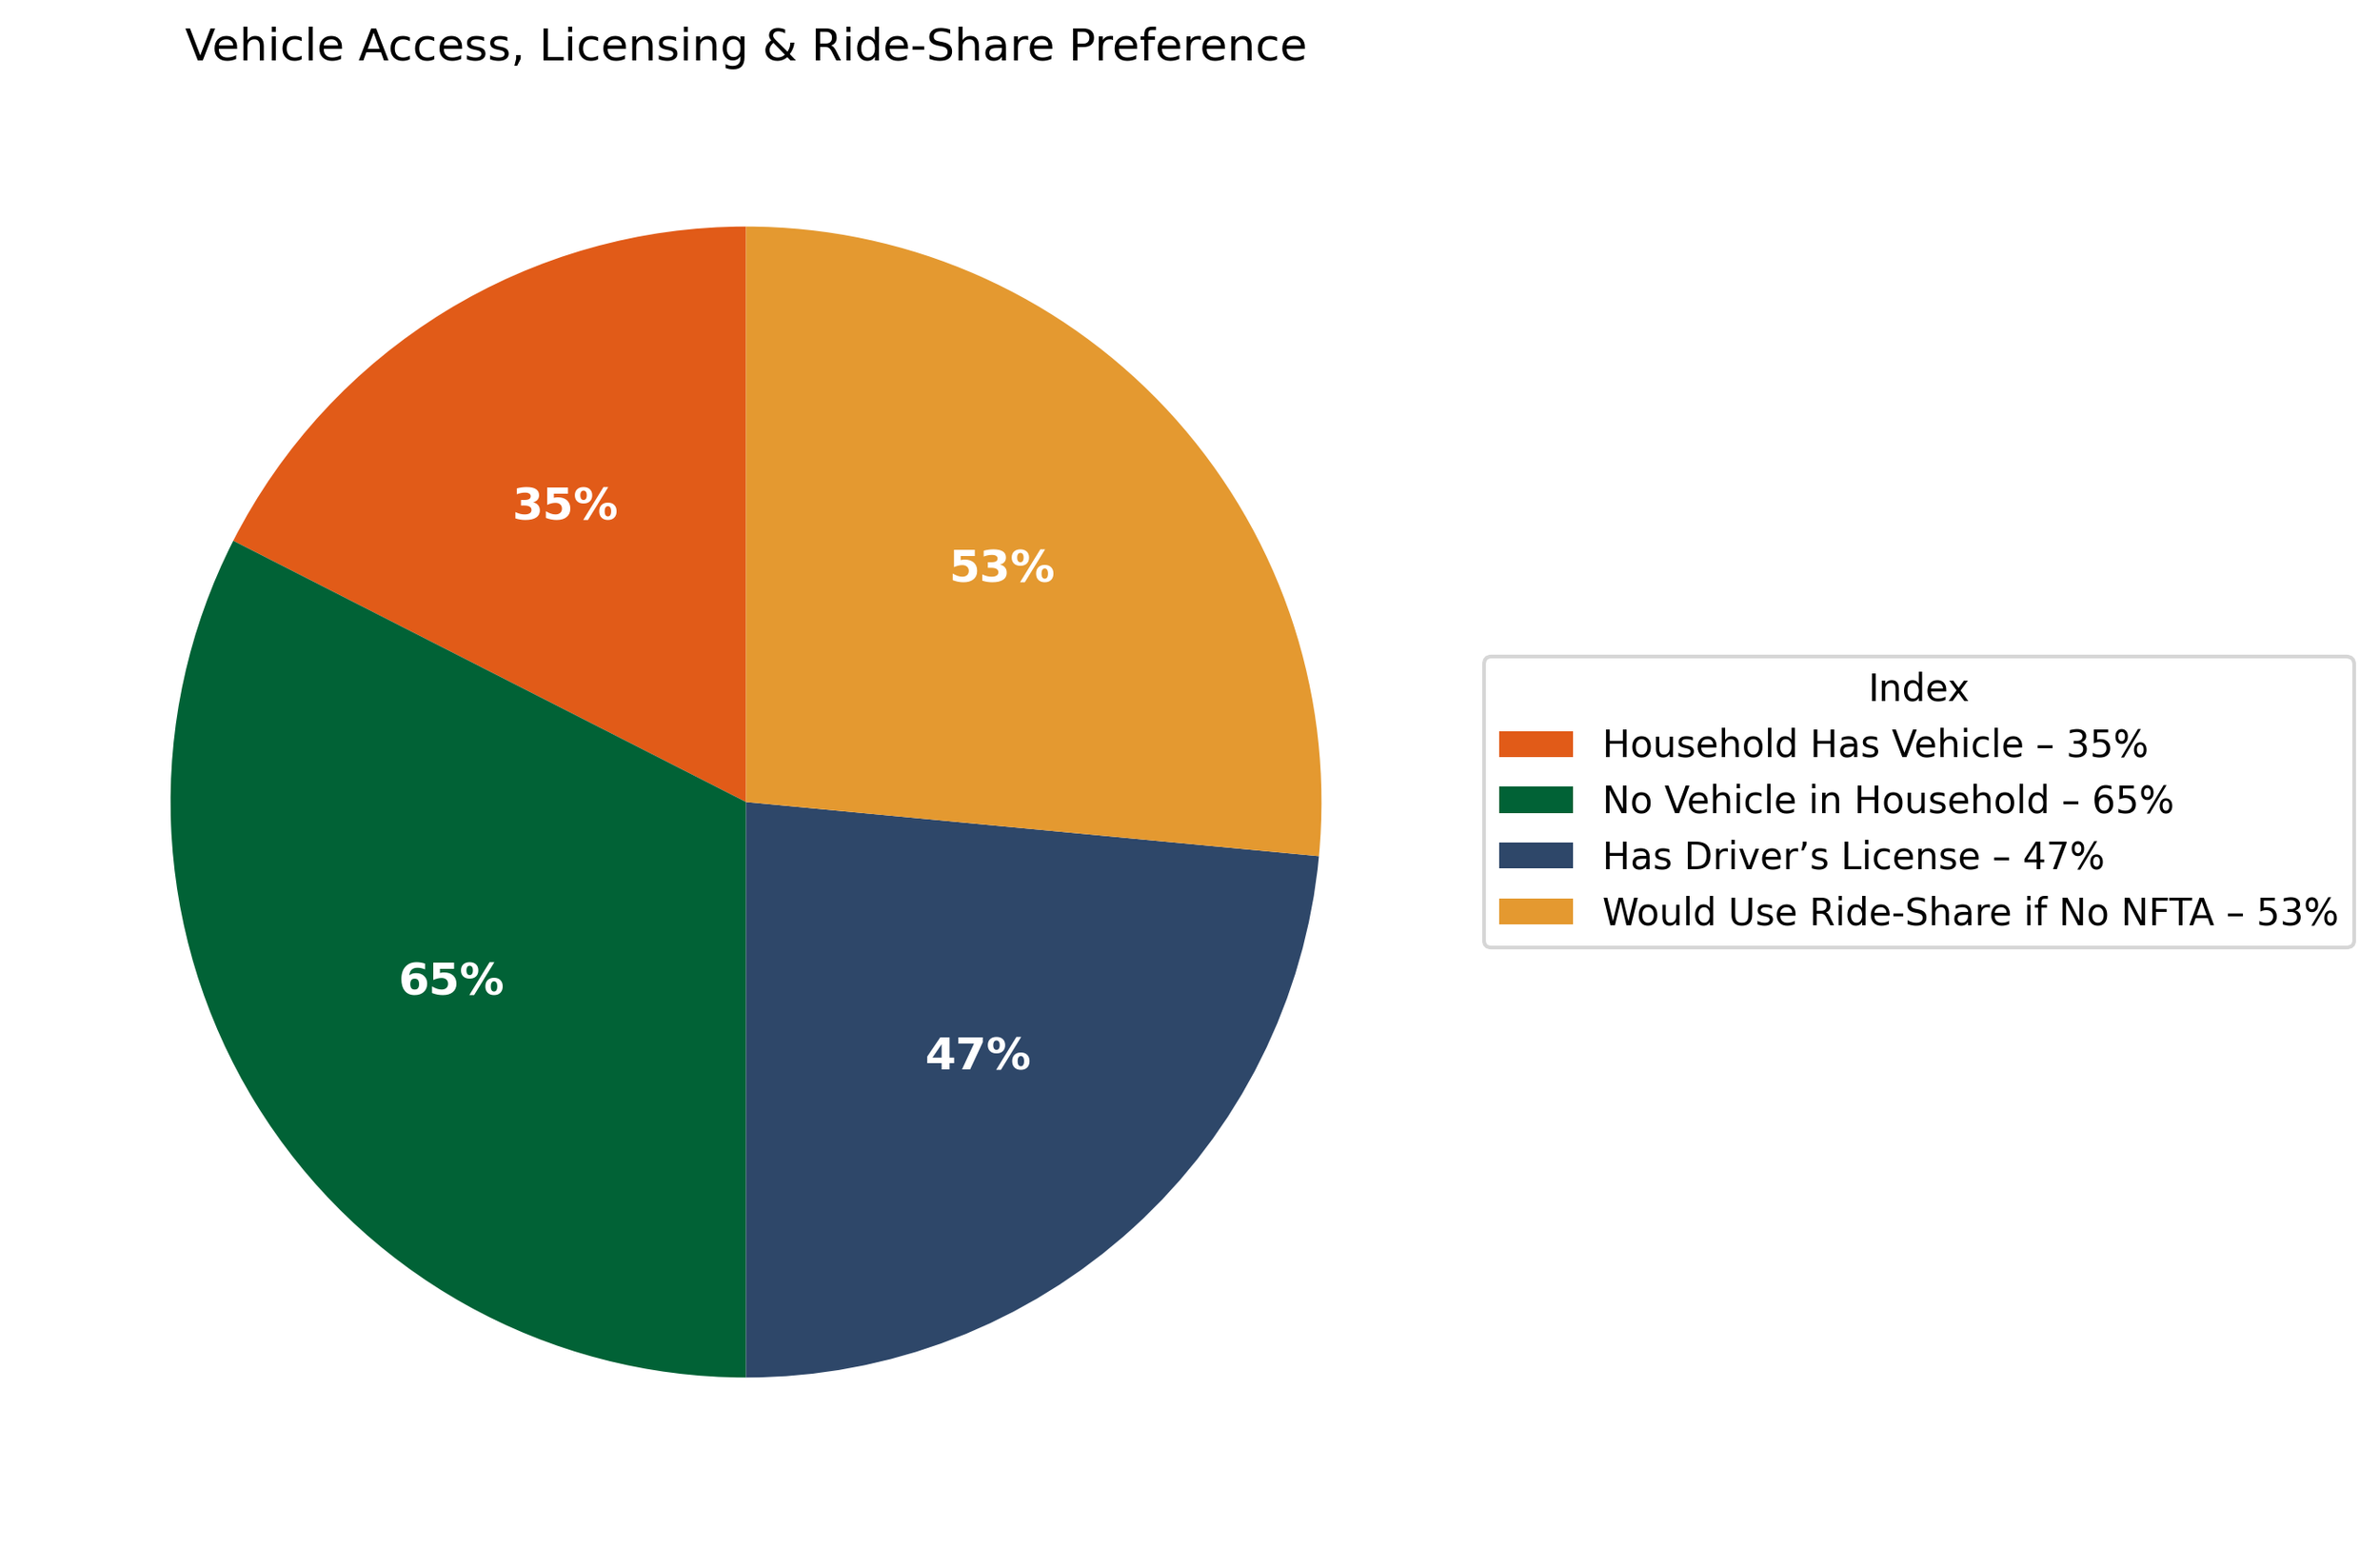
35% of riders live in households with at least one vehicle
65% of riders do not have a car in their household
47% of riders have a valid driver's license
53% of riders would take a ride-share/taxi service if NFTA service was not available
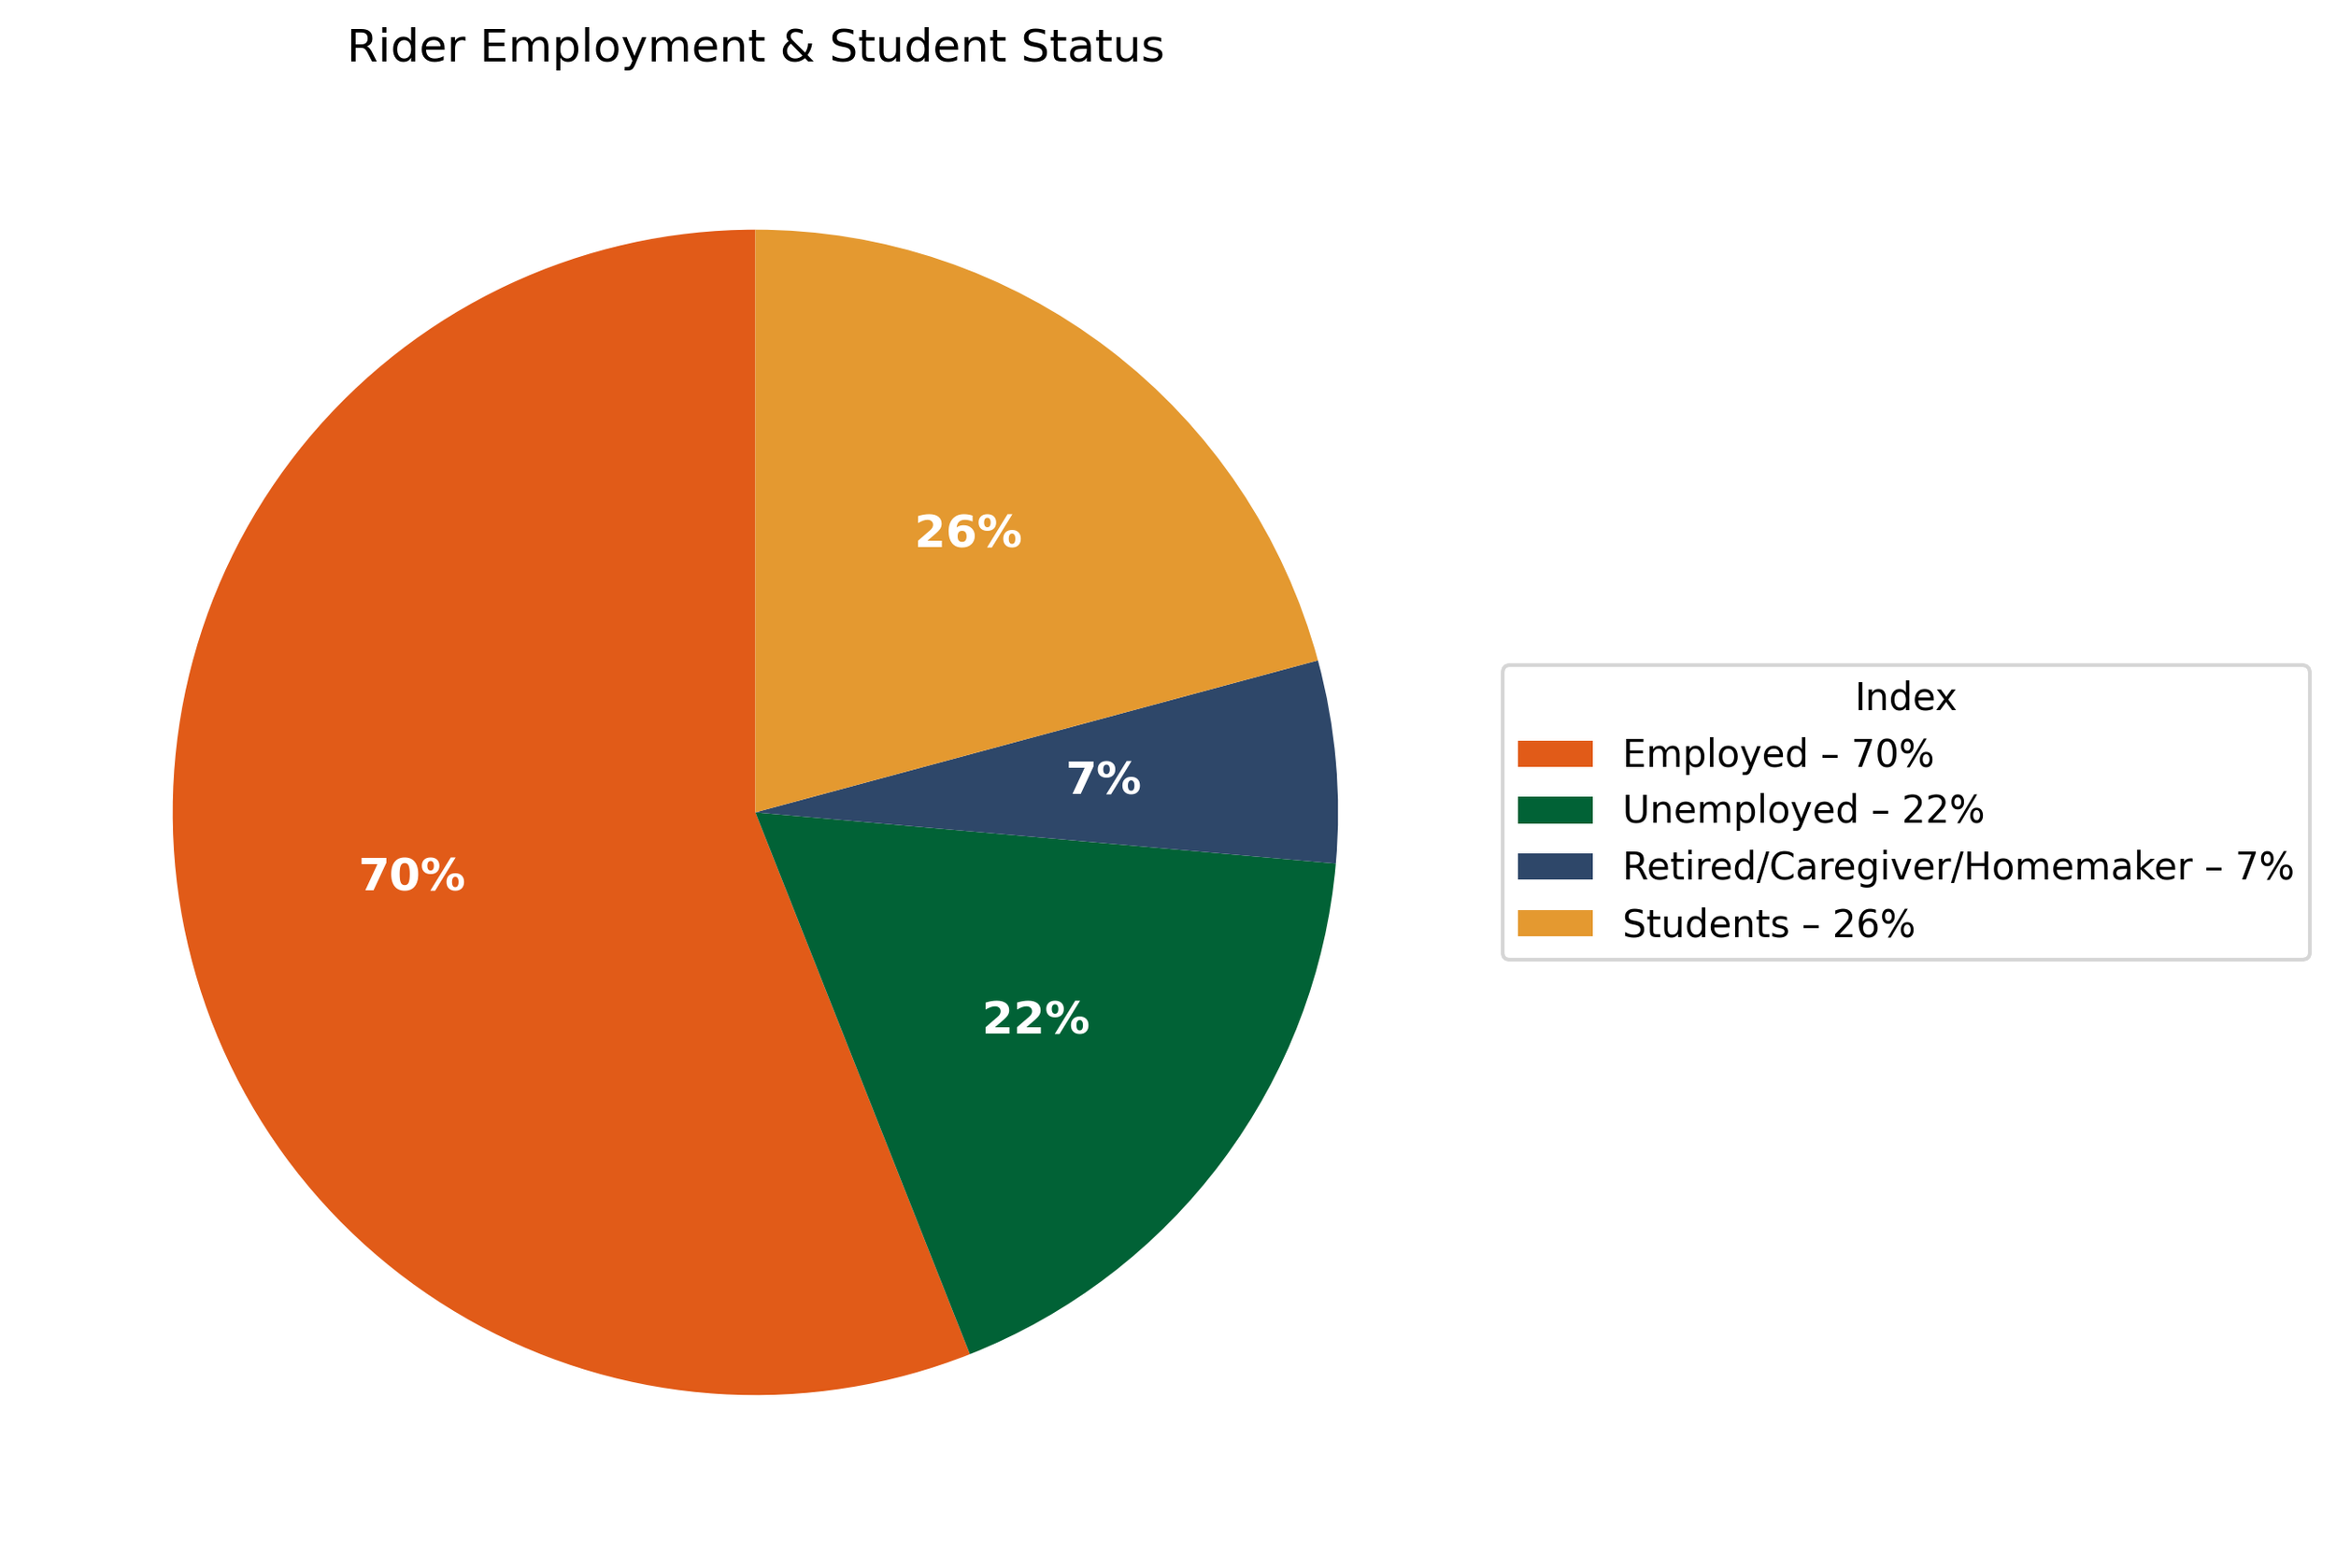
70% of riders are currently employed
22% of riders are currently unemployed
7% of riders are either retired, a caregiver or homemaker
26% of riders are students
41% of riders live in households with an income less than $15,000 per year
Survey Documentation
The full report and executive summary may be downloaded using the links below.