
The performance measures assist in identifying safety and congestion issues impacting the regional transportation system, as well as critical corridors. The evaluation of the performance measures helps determine the existing or forecast future types and level of congestion within the CMP Network. GBNRTC uses the analysis of congestion problems and needs to determine where consideration should be given to implementing congestion management strategies when performance measures are not being met.
Safety
Crashes on all of the major roadways in the region that occurred in 2023 are recorded by NITTEC. These data are represented in their annual report by a series of charts that show the number of crashes and the severity of the crash. The description of crash severity is below.
Incident Severity
Minor: Typically one or two vehicle crashes with no or minor injuries (closures less than 30 minutes).
Intermediate: Typically multiple vehicle crashes involving injuries (expected duration of greater than 30 minutes and less than 2 hours).
Major: Typically crashes involving hazardous materials, fatalities, tractor-trailers or full road closures with detouring of traffic (expected duration of greater than two hours).
Crash Severity
Additional Crash breakouts for the following corridors:
I-90 Crashes
I-190 Crashes
I-290 Crashes
Route 33 Crashes
Other Roadway Crashes
System Reliability
Reliability is tracked at a regional/system, corridor, and transit level using NPMRDS. The regional travel demand model and NFTA data are used for analysis.
Regional Level
Year 2023 NPMRDS data indicates that overall the region’s major roadways have a reliability index for travelers of 96% or more.
Percent of Miles Traveled Reliable for CMP Network
Interstate 98%
Expressway 99%
Major Arterial 94%
Interstate 94%
Expressway 94%
Major Arterial 90%
At a regional level GBNRTC uses reliability and delay to monitor congestion. Key performance indicators are shown in the maps below.

Level of Travel Time Reliability (LOTTR)
LOTTR is defined as the ratio of the longer travel times (80th percentile) to a normal travel time (50th percentile), and segments with a ratio of 1.50 or higher are considered unreliable. The current LOTTR for the average weekday is shown here.

Person Hours of Excessive Delay (PHED)
Excessive delay means the extra amount of time spent in congested conditions defined by speed thresholds that are lower than a normal delay threshold. For the purposes of this rule, the speed threshold is 20 miles per hour or 60 percent of the posted speed limit, whichever is greater. The current PHED for the average weekday is shown here.

Planning Time Index (PTI) (95th Percentile)
The amount of time a traveler should allow ensuring on-time arrival 95% of the time. This measure indicates the travel time reliability of a route. The objective benchmark for peak PTI is below 2.50. ). The current PTI for the average weekday is shown here.

Travel Time Index (TTI)
The measure of average conditions that indicates how much longer, on average, travel times are during congestion compared to during the free-flow travel time. The objective benchmark for peak TTI is below 1.50. For all highways, Free Flow Travel Time calculated using 55 mile per hour (mph). The current TTI for the average weekday is shown here.
Corridor Level SUMMARIES
Travel Time Performance
NITTEC evaluates and produces corridor level travel time performance reports. Measures shown are Average Travel Time Index (TTI), Level of Travel Time Reliability (LOTTR) and Congested Hours from 2021 to 2023. The corridors evaluated are:
I-90 between Exit 50 (I-290) and Exit 55 (Route 219 / Ridge Road)
I-190 between I-90 and Exit 7 (Route 5 / Skyway Overpass)
I-190 between Exit 7 (Route 5 / Skyway Overpass) and Exit 16 (I-290)
I-190 between Exit 16 (I-290) and Exit 21 (Buffalo Avenue)
I-290 between I-190 and I-90
Route 33 between I-90 and Oak/Elm Street
Route Activity and Number of Incidents
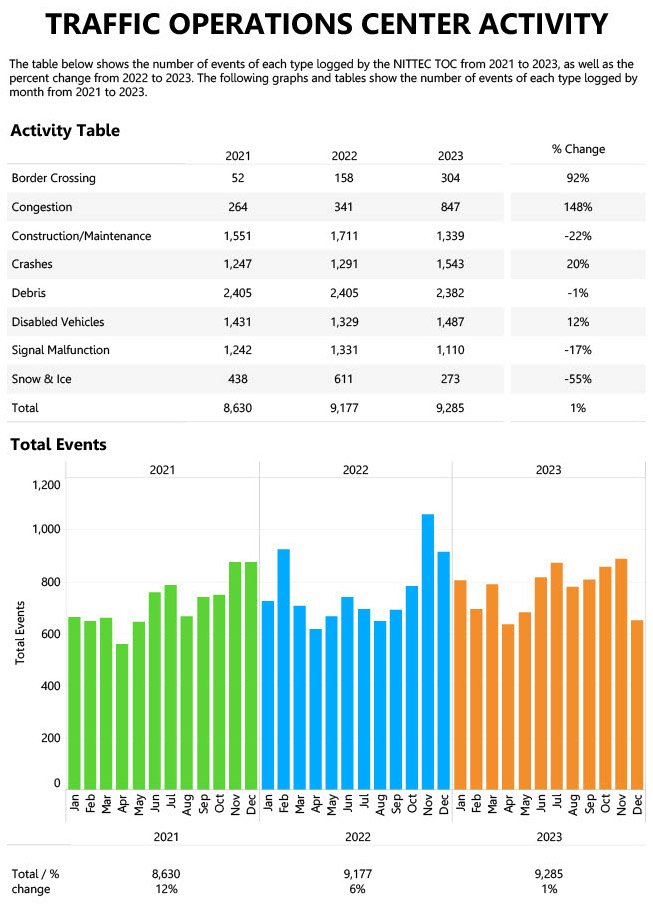
A comparison of route activity or non-recurring congestion related events for the major corridors is shown below for 2021 and 2023 from NITTEC Annual Report. These include monthly incidents related to crashes, congestion, construction & maintenance, disabled vehicles, debris, signal malfunction, snow & ice, and border crossings.


Transit Level
On-Time Performance - Fixed Route
NFTA-Metro monitors the efficiency of the service it provides. Metro “On-Time Performance” is the calculated difference between the actual time a Metro vehicle arrives at a specific stop compared to the scheduled arrival.
Freight Movement & Economic Activity
Performance for freight considers travel time reliability and border crossing delays within the CMP Network.

Truck Travel Time Reliability (TTTR)
The TTTR ratio is generated by dividing the 95th percentile truck travel time by the 50th percentile truck travel time for each reporting segment. For more information on the LOTTR measure, visit FHWA's Transportation Performance Management website. The objective benchmark for TTTR is below 2.50. The current TTTR for the average weekday is shown here.
Border Crossing Delay
As with the highways, the three major border crossings between Western New York and Southern Ontario in both directions of travel experience fluctuations in travel time. These are analyzed in terms of delay: the number of minutes needed to cross one of the following bridges in addition to the free flow travel time.
Peace Bridge
Lewiston-Queenston Bridge
Rainbow Bridge
The graphs here show the distribution of passenger and truck delays at all crossings into the U.S. and Canada in 2023 by month and by hour of the day.
Peace Bridge Passenger Delay
Lewiston-Queenston Bridge Passenger Delay
Rainbow Bridge Passenger Delay
Peace Bridge Truck Delay
Lewiston-Queenston Truck Delay
Additional Border Crossing Data
Additional border crossing data is available below in a series of graphs showing the percentage of time during 2023 when there was simultaneous delay (crossing times greater than 10 minutes) into Canada and into the U.S. Along with total number of vehicles crossing at the Peace Bridge, Lewiston-Queenston Bridge and Rainbow Bridge in both the Canada-bound and U.S.-bound directions between 2021 and 2023
Border Crossing Data
Simultaneous Delay
Border Crossing Volumes
Congestion Reduction
GBNRTC assesses modes of a travel on a regional and corridor level.
Regional
The review of daily person trip travel statistics (Table 1) helps GBNRTC understand how travel patterns will shift in the future to identify strategies to serve travel in the region.
Table 1: Estimated Daily Person Trip Travel Statistics
Current
| Mode | Person Hours Traveled | Person Miles Traveled | Person Trips |
|---|---|---|---|
| Walk/Bike | 134,203 | 366,875 | 323,057 |
| Transit | 43,364 | 366,944 | 70,804 |
| Auto | 737,925 | 21,062,023 | 3,767,701 |
| School Bus | 45,683 | 1,188,386 | 190,078 |
2050
| Mode | Person Hours Traveled | Person Miles Traveled | Person Trips |
|---|---|---|---|
| Walk/Bike | 155,069 | 423,505 | 373,893 |
| Transit | 57,611 | 470,260 | 103,433 |
| Auto | 819,971 | 22,578,900 | 4,085,301 |
| School Bus | 50,683 | 1,279,635 | 205,528 |
Further assessment of daily vehicle travel statistics (Table 2) provides GBNRTC an understanding of how travel in the region will grow and specifically increases in congestion.
Table 2: Estimated Daily Vehicle Travel Statistics
current
| Measure | Auto | Truck | Total |
|---|---|---|---|
| Vehicle Miles Traveled | 22,025,625 | 2,144,074 | 24,169,698 |
| Vehicle Hours Traveled (Congested) | 750,564 | 64,689 | 815,253 |
| Vehicle Hours Traveled (Free Flow) | 570,353 | 55,067 | 625,420 |
| Delay in Hours | 180,211 | 9,622 | 189,833 |
2050
| Measure | Auto | Truck | Total |
|---|---|---|---|
| Vechile Miles Traveled | 23,523,106 | 2,805,563 | 26,328,669 |
| Vehicle Hours Traveled (Congested) | 814,267 | 84,510 | 898,777 |
| Vehicle Hours Traveled (Free Flow) | 606,495 | 70,493 | 676,988 |
| Delay in Hours | 207,772 | 14,017 | 221,790 |
The measure of regional accessibility (Table 3) help GBNRTC identify how well the region is served by transit and if additional investments may be needed in the future to improve accessibility.
Table 3: Accessibility Measures
| Measure | CURRENT | 2050 |
|---|---|---|
| Work Trips Within 45 Minutes by Transit | 158,900 Trips | 181,388 Trips |
| Households Within 15 Minutes of CBD | 187,612 Households | 203,292 Households |
| Peak Highway Travel Time: Downtown to Airport | 14 Minutes | 15 Minutes |