
The performance measures support the goals and objectives of the Congestion Management Process (CMP) and measure the local and regional transportation system reoccurring and non-reoccurring congestion. The table below shows the performance measures for the CMP. The tables list the data type, source, availability, and coverage of the dataset used for each performance measure.
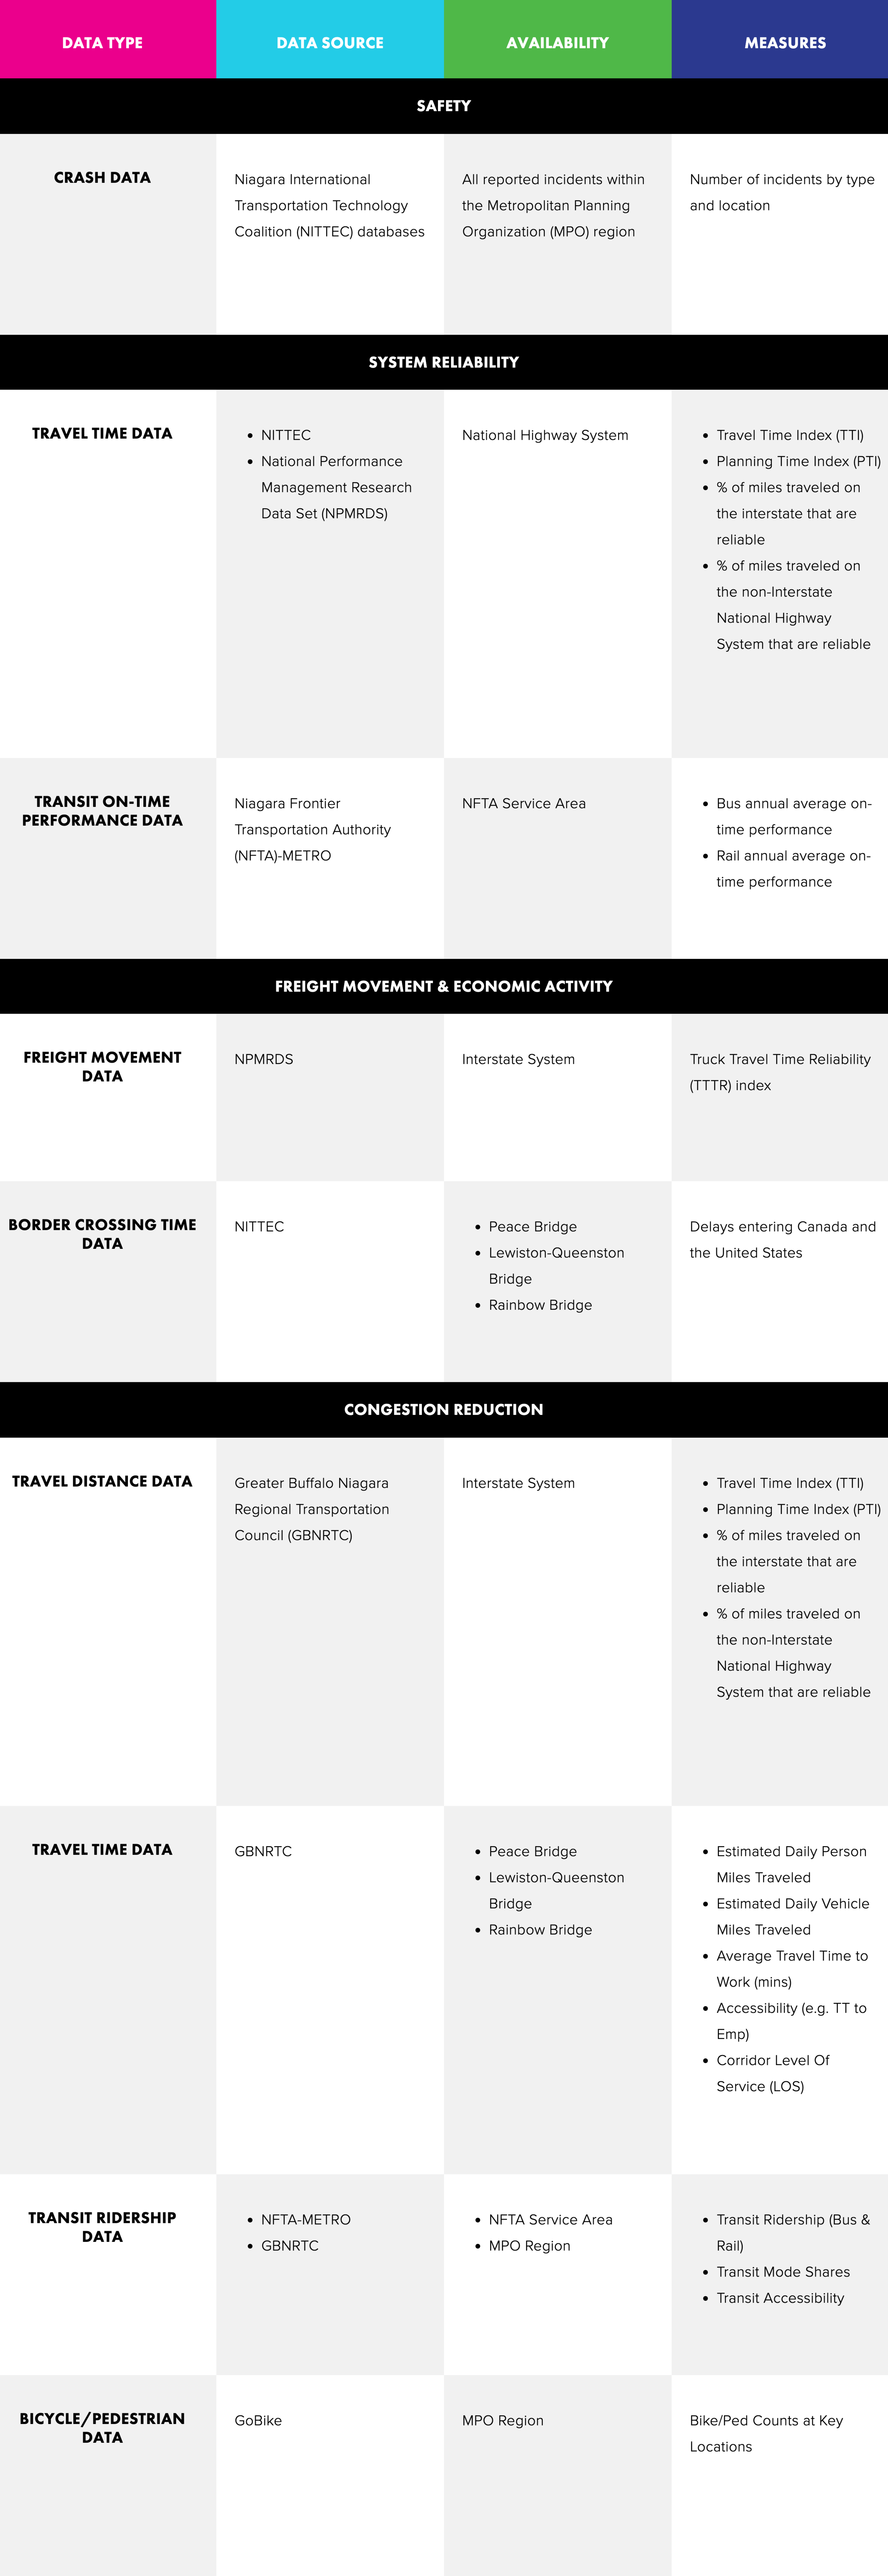
Data Type
Data Source
Availability
Measures
Safety
Crash Data
Niagara International Transportation Technology Coalition (NITTEC) databases
All reported incidents within the Metropolitan Planning Organization (MPO) region
Number of incidents by type and location
System Reliability
Travel Time Data
- Niagara International Transportation Technology Coalition (NITTEC) databases
- National Performance Management Research Data Set (NPMRDS)
- Niagara International Transportation Technology Coalition (NITTEC) databases
- National Performance Management Research Data Set (NPMRDS)
National Highway System
- Travel Time Index (TTI)
- Planning Time Index (PTI)
- % of miles traveled on the interstate that are reliable
- % of miles traveled on the non-Interstate National Highway System that are reliable
- Travel Time Index (TTI)
- Planning Time Index (PTI)
- % of miles traveled on the interstate that are reliable
- % of miles traveled on the non-Interstate National Highway System that are reliable
Transit On-Time Performance Data
Niagara Frontier Transportation Authority (NFTA)-METRO
NFTA Service Area
- Bus annual average on-time performance
- Rail annual average on-time performance
- Bus annual average on-time performance
- Rail annual average on-time performance
Freight Movement & Economic Activity
Freight Movement Data
National Performance Management Research Data Set (NPMRDS)
Interstate System
Truck Travel Time Reliability (TTTR) index
Border Crossing Time Data
Niagara International Transportation Technology Coalition (NITTEC) databases
- Peace Bridge
- Lewiston-Queenston Bridge
- Rainbow Bridge
- Peace Bridge
- Lewiston-Queenston Bridge
- Rainbow Bridge
Delays entering Canada and the United States
Congestion Reduction
Travel Distance Data
National Performance Management Research Data Set (NPMRDS)
Interstate System
- Travel Time Index (TTI)
- Planning Time Index (PTI)
- % of miles traveled on the interstate that are reliable
- % of miles traveled on the non-Interstate National Highway System that are reliable
- Travel Time Index (TTI)
- Planning Time Index (PTI)
- % of miles traveled on the interstate that are reliable
- % of miles traveled on the non-Interstate National Highway System that are reliable
Model Travel Time Data
GBNRTC Travel Demand Model
MPO Region Federal Aid Network
- Estimated Daily Person Miles Traveled
- Estimated Daily Vehicle Miles Traveled
- Average Travel Time to Work (mins)
- Accessibility (e.g. TT to Emp)
- Corridor Level Of Service (LOS)
- Estimated Daily Person Miles Traveled
- Estimated Daily Vehicle Miles Traveled
- Average Travel Time to Work (mins)
- Accessibility (e.g. TT to Emp)
- Corridor Level Of Service (LOS)
Transit Ridership Data
- Niagara Frontier Transportation Authority (NFTA)-METRO
- Greater Buffalo Niagara Regional Transporation Council
- Niagara Frontier Transportation Authority (NFTA)-METRO
- Greater Buffalo Niagara Regional Transporation Council
- NFTA Service Area
- MPO Region
- NFTA Service Area
- MPO Region
- Transit Ridership (Bus & Rail)
- Transit Mode Shares
- Transit Accessibility
- Transit Ridership (Bus & Rail)
- Transit Mode Shares
- Transit Accessibility